转载自网络,版权归原作者所有
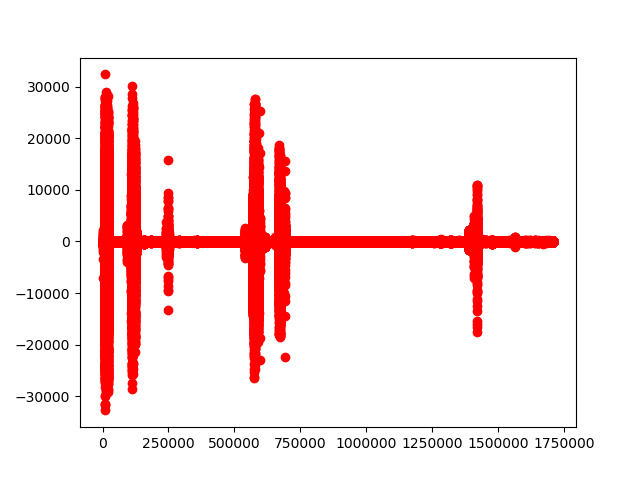
hello3.txt文件内部数据如下
。。。。。。7,2,6,-12,-10,-7,-1,2,9,。。。。。。
python脚本
import numpy as np
import pylab as pl
import math
import codecs
file=codecs.open("hello3.txt","r")
lines=" "
for line in file.readlines():
    lines=lines+line
ys=lines.split(",")
yss=[]
ays=list()
axs=list()
i=0
max1=pow(2,16)-1
for y in ys:
    if y.strip()=="":
        continue
    yss.append(y)

for index in range(len(yss)):

    y1=yss[index]

    i+=1;
    y=int(y1)

    ays.append(y)
    axs.append(i)
#print  i
file.close()
pl.plot(axs, ays,"ro")# use pylab to plot x and y
pl.show()# show the plot on the screen
结果

 IDEA激活码


